A major concept in Six Sigma and other Lean manufacturing ideologies is improving the processes of production. Improvement allows products and services to better match customer needs, and establishes a more efficient and profitable facility. The key to this is pinpointing those spots for improvement in the first place.
The iterative nature of improvement ensures a continuous cycle of enhancement, where feedback mechanisms and data-driven insights play a pivotal role. Regular assessments, performance metrics, and customer feedback contribute to the ongoing refinement of processes, allowing for adaptability and responsiveness to evolving customer needs and market demands.
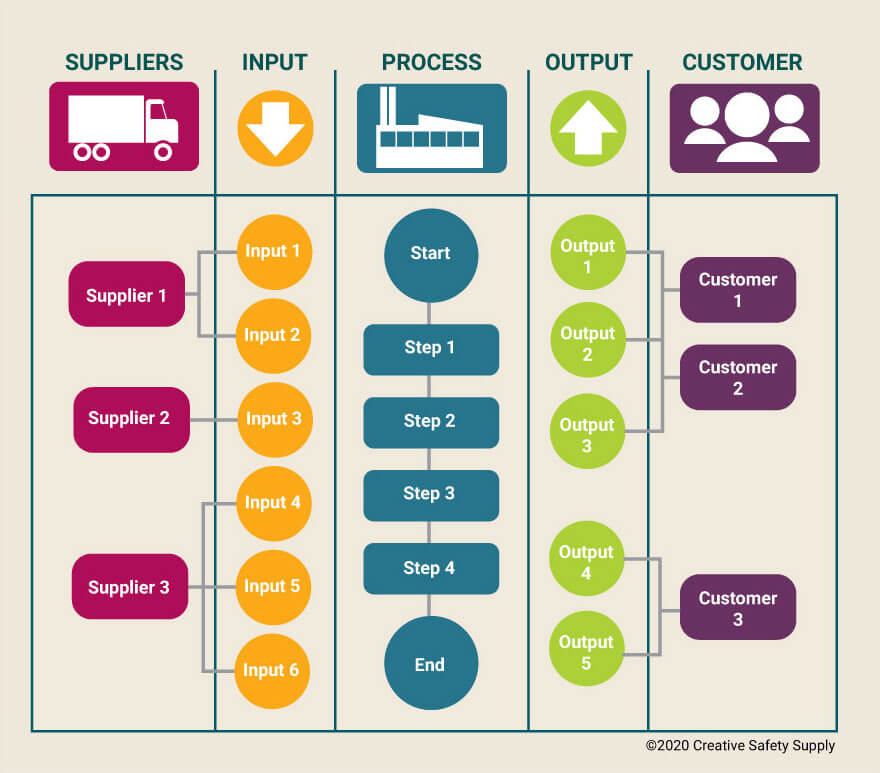
SIPOC diagrams are a process improvement tool that achieves exactly this; they identify what is working and what is failing, and determine whether the company is meeting the needs of its customers. SIPOC stands for:
- Suppliers, the places where a business gets its resources from
- Inputs, the resources required for the process
- Process, the steps required to change inputs into outputs
- Outputs, the resources/products that are sent to customers
- Customers, recipients or users of the outputs
Take, for example, the main operation of a coffee shop. The suppliers are food producers and the manufacturers of equipment such as coffee grinders and espresso machines. Inputs include coffee beans, water, milk, flavored syrup, and baked goods or other food. The process involves creating coffee and preparing other foods, which become the outputs provided to customers. The customers are people who stop by to purchase their breakfast. By breaking this entire process down into a diagram, someone who has never worked in a coffee shop can understand each step needed to take resources from suppliers and create a product that is eventually handed over to customers.
SIPOC diagrams are a “high-level” process map, which means they provide a bird’s-eye view of a process and present information in the most simple way possible, so even someone who is unfamiliar with a company and its business processes can easily understand. With a straightforward structure, these diagrams are a tool that ensures everyone has a mutual understanding. They’re most beneficial to use before any decisions or improvements are made to a process, and work well with other Lean methodologies; for example, they may be implemented during the “Define” phase in the DMAIC cycle, or at the beginning of a Kaizen event.
Before you start a process improvement project, creating a diagram may be the difference between failure and success. If for instance a coffee shop’s customers are waiting in line for a very long time, a diagram may help pinpoint where the problem originates from—and show that there are issues with the outputs or inputs, rather than the workers.
How to Create a SIPOC Diagram
Making a diagram is simple; you can draw one by hand, use a pre-made template, or use a computer program to create a chart. Each column in this chart should represent the five abbreviations, in order: Suppliers, Inputs, Process, Outputs, and Customers. First, identify the process you’re attempting to analyze or improve. Write the name of this process in the middle column, and list a few brief steps, including the starting and ending points.
From there, write down 3-6 main outputs in the output column, and 3-6 main inputs in its column. Keep the tone neutral and avoid categorizing resources into “good” or successful ones and “bad” ones; the diagram is meant to simply list them. Identify the people who benefit from this process. These will typically be customers, but if you’re analyzing an internal process, the “customers” will be coworkers or members of a specific department. Identify the suppliers as well, again listing a handful of key ones. As long as you begin with identifying the process, the rest of the columns may be filled out in whichever order you choose.

As a high-level process map, a SIPOC chart should contain very basic information; it is not necessary to go into a lot of detail. You are simply trying to get a bird’s-eye view of the process, so you can leave out feedback, decision points, or opinions. The most important part of creating this diagram is to define each step of the process, from assembling raw materials given by the suppliers to the end product provided to customers, and pinpoint any areas that could use improvement.
Benefits of Using SIPOC
Using a Suppliers, Inputs, Process, Outputs, Customers diagram can be beneficial for a company in a variety of ways. The diagram can be used to:
- Provide a general overview of a process to anyone who is unfamiliar with it (such as a new team member)
- Help people understand a brand-new process or how an existing one will change
- Set the foundation for Kaizen or a DMAIC strategy
- Implement a mindset of problem-solving for future improvement
On top of this, SIPOC diagrams clarify certain elements of a process, such as who the true customers and suppliers are, requirements for the inputs so the end product meets customer needs, and what type of data should to be collected in order to measure results. Once these elements have been determined, an improvement project may begin.
What is a Six Sigma Process Map?
The primary objective of incorporating Lean Six Sigma methodology into operations is to reduce variations and eliminate waste, which improves the overall efficiency and quality of a company. When you begin to incorporate Six Sigma, it’s important that everyone involved has a mutual and basic understanding of the current process. One of the most effective ways of achieving this understanding is to create a Six Sigma process map.
Six Sigma Process Maps vs. SIPOC Diagrams
This process map is much like SIPOC, but it focuses solely on the process, how it works, and how it can improve by depicting the beginning, middle, and end (or desired end). Another main difference is that process maps can be both high-level or very detailed, whereas SIPOC diagrams are as simple as possible. Creating a map compares the current process to a potentially better, new process and identifies aspects that could be simplified. It also answers questions such as:
- Does the process face an overarching problem?
- What does the optimal process look like?
- Are there any unnecessary steps, or steps that can be simplified?
- Which steps present an opportunity for improvement, such as reducing waste?
Six Sigma process maps can be used in any business where Lean processes are applied, and they can be created at the beginning of a new process or applied to an existing one to achieve improvement. In many cases, businesses will create a process map to ensure a complete understanding and combine the knowledge of everyone associated with the process, before creating a SIPOC diagram with the additional sections for customers, suppliers, inputs, and outputs.
Customer, Output, Processes, Input, Supplier (COPIS)
COPIS diagrams are the same as SIPOC diagrams; they offer a high-level overview of a process, except from the point of view of the customer. These are created the same way with the same factors (Customers, Outputs, Process, Inputs, Suppliers) and are easy and quick to make, functioning as a useful tool during the “Define” phase of the DMAIC cycle to ensure that the process meets customer needs as much as possible. It’s best to use COPIS when designing a new process, as this strategy begins by defining customer needs, and then you can outline all the steps required to meet those needs.
This particular approach provides several major advantages. Any work that is put into a process which the customer doesn’t value is regarded as waste. For example, attempting to make a coffee shop more environmentally conscious by implementing sustainably-sourced coffee beans will result in waste if customers aren’t interested in this type of coffee, dislike the increase in prices, and take their business elsewhere.
Improvements to a process should also increase value to the customer, and using a COPIS diagram makes it easy to see how the process can be matched up to customer requirements by putting what your customers want at the forefront. This results in value-added activities that ensure CTQ (critical-to-quality) factors are being met. Many businesses find that they benefit more from using a COPIS chart and focusing on their customers.
Successful Tools for Six Sigma
Lean Six Sigma methodology reduces variations and defects while enhancing continuous improvement. SIPOC diagrams, Six Sigma process maps, and COPIS diagrams are all useful tools that may help any business successfully implement a Six Sigma program. These ensure that all workers are on the same page, and simplify the process so it’s easily understandable. Before you embark on a process improvement project, utilize these tools to be able to pinpoint spots for improvement, define the process itself, and identify steps to take so products and services match what your customers need.
Additional Six Sigma facts:
- A SIPOC diagram is a tool used by a team to identify all relevant elements of a process improvement project before work begins. It helps define a complex project that may not be well scoped, and is typically employed at the Measure phase of the Six Sigma DMAIC (Define, Measure, Analyze, Improve, Control) methodology. Source: https://www.isixsigma.com/sipoc-copis/sipoc-diagram/
- The acronym SIPOC stands for Suppliers, Inputs, Process, Outputs and Customer. Using information from these five areas creates a process map that gives a high-level overview of a Six Sigma project. It visualizes how everyone in the process receives materials or data from each other, and is often used to improve or understand processes that impact customer experience. Source: https://www.sixsigmadaily.com/what-is-a-sipoc-diagram/
- A SIPOC diagram can be created in seven steps: 1) Identify the process, 2) Identify the outputs, 3) Identify the customers, 4) Identify the inputs, 5) Identify the suppliers, 6) List the process steps, and 7) Review and validate the diagram. Source: https://asana.com/resources/sipoc-diagram
- A SIPOC diagram can also be extended with two additional components: Constraints and Measures. Constraints are the limitations or restrictions that affect the process, such as budget, time, resources, regulations, etc. Measures are the metrics or indicators that are used to evaluate the process performance, such as quality, cost, efficiency, customer satisfaction, etc. Source: https://asq.org/quality-resources/sipoc
- A SIPOC diagram can be used for various purposes, such as scoping a project, identifying stakeholders, communicating with senior management, finding improvement opportunities, and aligning the process with customer needs. Source: https://www.learnleansigma.com/guides/sipoc-analysis/
Similar Articles
- What is DFSS (Six Sigma)?
- Six Sigma Principles
- Lean versus Six Sigma: Which is better for your business?
- Six Sigma
- Understanding Risk Assessments in the Workplace
- Control Charts: A Basic Component of Six Sigma
- Six Sigma Belt Levels [Hierarchy of Certification]
- Understanding the Principles of Lean Construction
- Understanding Total Quality Management
- What is Process Mapping? [Definition, Examples & Tools]


