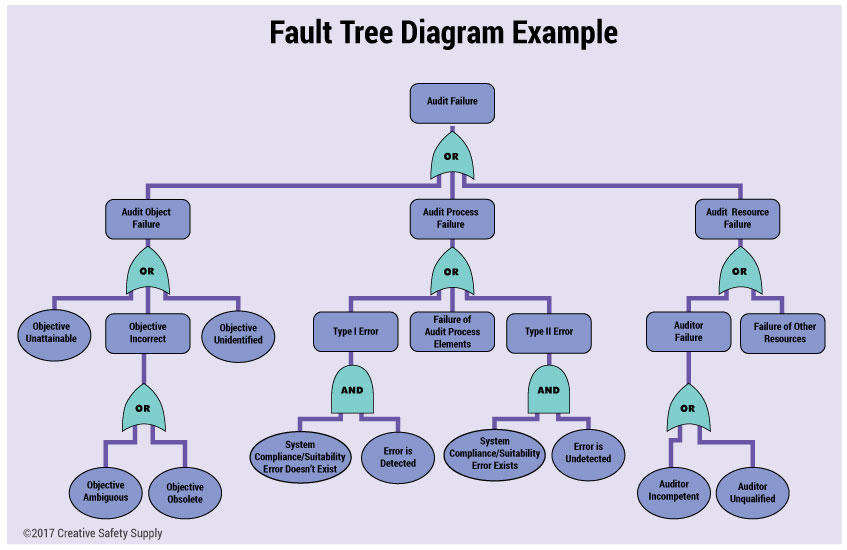
A fault tree analysis is a top-down diagram used to identify where and how the system can fail. Any system is vulnerable to fail, and an FTA maps out the combinations of equipment failure and human error that can lead to an undesired event (think worst case scenario). Leaders can use a fault tree analysis to determine proactive steps that can be taken to address the root cause and avoid or reduce the risk of problems.
Bell Laboratories developed the fault tree analysis in 1962 as a way to evaluate ballistics systems for the U.S. Air Force. The concept over the years has spread to other branches of the military, the aircraft industry, the nuclear power industry, and was formally recognized by OSHA as an appropriate method for process hazard analysis. While the fault tree analysis can be applicable in any type of industry, they are most common in high-risk environments, different fields of engineering, and system safety.

The first step to creating an FTA is to identify the system that will be evaluated. While a fault tree analysis can be used to investigate a current issue, they are most effective for finding issues before they even occur. Furthermore, an analysis should be completed on systems that have not yet been implemented, but it can also be helpful to complete an FTA for existing systems.
As you can see from the diagram, the chart starts with one block at the top, and branches down through different paths. The top undesired event(worst case scenario) resulting from system failure is placed at the top. The next step is to determine the possible reasons for that particular failure to occur. These are placed in the boxes right under the top undesired event and considered level two elements. Continue to break down each of these elements until satisfied you have listed each possible cause. Connecting these elements with “and” and “or” gates is the next step. These gates represent the relationship between elements and are ultimately the defining characteristic of the FTA.
An easy and effective way begin the analysis itself is by utilizing a template. With a template already mapped out, the important and relevant information is then plugged into the diagram. By organizing information and visually representing paths and relationships between the elements of a possible system failure, it can help managers identify the cause of known issues and predict potential concerns. Finding the root cause allows issues to be resolved as efficiently as possible and will help to effectively improve the system or design a new system.
Similar Glossary Terms
- FMEA (Failure Modes and Effects Analysis)
- Job Safety Analysis (JSA)
- DFMEA (Process Failure Modes and Effects Analysis)
- CTQ Tree
- Root Cause Analysis
- PFMEA (Process Failure Modes and Effects Analysis)
- FRACAS (Failure Reporting, Analysis and Corrective Action System)
- Safety Engineering
- JHA


