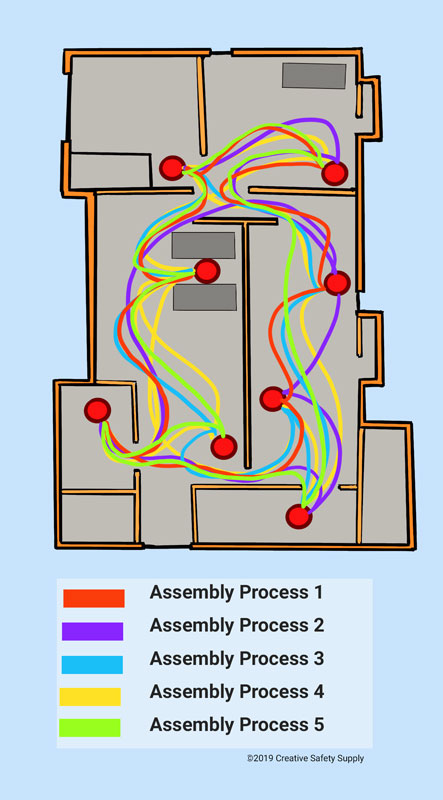
Many charts and diagrams exist to help Lean practitioners analyze and improve their workplaces. A spaghetti diagram is a basic Lean tool that helps people identify waste as it is a visual representation of the path an item or activity takes with a continuous flow line. These drawings are called spaghetti diagrams because when they’re finished, they look a bit like a plate of spaghetti noodles.

Spaghetti diagrams are part of a Lean Manufacturing method called Gemba. In Japanese, Gemba means “the real place.” This Lean method refers to the place where work is performed, where the value is created for the customer. It is, to borrow an old phrase, where the sausage gets made. This is a method was created for managers to get a better understanding of the process that yields the products the company creates. Once the manager has a better understanding of how the manufacturing processes work in “the real place,” the manager will then be able to make adjustments and improvements to make things more efficient.
How to Make a Spaghetti Diagram
To create a spaghetti diagram, users should first draw a map of the workspace. Then they should observe the process in question, whether that’s a manufacturing process, a sales process, or shipping an order in a warehouse. Whoever is creating the diagram should note what time observation started and include the start and end times of breaks.
The spaghetti diagram allows the user to trace a product, a piece of information, or a person throughout the observed process. So, with a pen or pencil, trace the path the product, information, or person takes to reach its final state or complete a task. It is important to include every movement, no matter how small, and multiple processes can be analyzed with different colored lines.
These lines will help people see if there is extra motion or transportation taking place that could potentially be eliminated. The diagram allows managers to see where congestions occur, where delays take place, or unnecessary repetitive movements; these are all areas that can be improved. Small movements may not seem like much when considered individually, but when taken together they can really add up.
Similar Glossary Terms
- Network Diagram
- SIPOC Diagram
- Fishbone Diagram
- Affinity Diagram
- 7 Wastes of Manufacturing
- Value Stream Mapping
- Gemba Defined
- Cellular Manufacturing
- Toyota Production System


