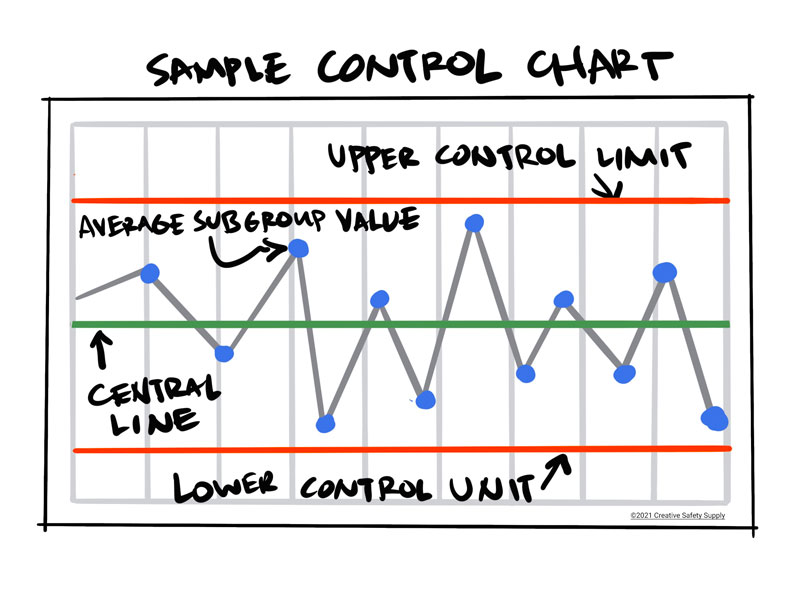
SPC stands for Statistical Process Control. It is a methodology that is widely used to continuously improve processes, and is a subset of Six Sigma. Six Sigma, one of the major techniques of Lean manufacturing, aims to prevent process variation and make sure that a company has the ability to consistently and reliably produce products and services that are of high quality. SPC is a vital strategy used during Six Sigma to assess process control and monitor variations. Ultimately, it aids in decision-making to eliminate variations and reduce waste, ensuring that processes operate as efficiently as possible.
SPC & Control Charts
SPC is typically associated with two tools: control charts and Design of Experiments (DOE). DOE is a method that allows people to investigate multiple causes of variation simultaneously, while control charts are a means to monitor an ongoing production process and identify variation. There are two types of process variation: 
- Common cause variations, which are considered to be naturally occurring and can be expected to happen within a process. These variations are “in control.”
- Special cause variations, which are not natural and are externally sourced. These are “not in control,” and reducing this kind of variation is the key to creating more efficient operations.
SPC is applied in three phases. First, the process and its specification limits are fully understood. Then, the process is stabilized to eliminate causes of variation. Lastly, ongoing process is observed and variation is detected. The ultimate aim to Statistical Process Control is to separate common cause variation from special cause variation in a process. Once it’s determined which variations are natural, and which ones are not, it becomes possible to eliminate special cause variation. Because common cause variation is to be expected, it cannot be eliminated, but may be reduced.
As part of Six Sigma, SPC is a methodology that monitors and continuously optimizes a process. It can help ensure that products are of high quality, wastes in production are eliminated, and that the likelihood of a finished product being scrapped is reduced.
Additional SPC facts:
- Statistical process control (SPC) is a quality management technique used to monitor and control industrial processes by analyzing and interpreting statistical data. It involves the collection and analysis of data to detect variations and trends within a process, enabling organizations to identify and address potential issues before they result in defects or deviations from desired standards. Source: https://asq.org/quality-resources/statistical-process-control
- A popular SPC tool is the control chart, originally developed by Walter Shewhart in the early 1920s. A control chart helps one record data and lets you see when an unusual event, such as a very high or low observation compared with “typical” process performance, occurs. Control charts attempt to distinguish between two types of process variation: common cause variation, which is intrinsic to the process and will always be present, and special cause variation, which stems from external sources and indicates that the process is out of statistical control. Source: https://asq.org/quality-resources/statistical-process-control
- SPC provides several significant benefits, such as minimizing waste and rework, increasing process efficiency, enhancing product quality, helping detect defects earlier, increasing product reliability, and helping analyze processes for improvement. SPC techniques are designed to evaluate and monitor processes for continuous improvement, which helps improve overall quality, customer satisfaction, and cost-efficiency. Source: https://bootcamp.umass.edu/blog/project-management/what-is-statistical-process-control-and-what-spc-chart
- In addition to the basic 7-QC tools, there are also some additional statistical quality tools known as the seven supplemental (7-SUPP) tools: data stratification, defect maps, events logs, process flowcharts, progress centers, randomization, and sample size determination. These tools can be used to complement the SPC methods and provide more insights into the process performance and improvement opportunities. Source: https://www.wallstreetmojo.com/statistical-process-control/
- A marked increase in the use of control charts occurred during World War II in the United States to ensure the quality of munitions and other strategically important products. The use of SPC methods diminished somewhat after the war, though was subsequently taken up with great effect in Japan and continues to the present day. Source: https://control.com/technical-articles/what-is-statistical-process-control-spc/
Similar Questions
- Is Six Sigma Lean?
- What is Design for Six Sigma?
- Can Six Sigma be used in service industries?
- How can Six Sigma help a company?
- What does APQP stand for?
- How is Six Sigma different from Kaizen?
- What is Six Sigma?
- How Can Six Sigma be Used in Construction?
- What are the benefits of Six Sigma?

