Control charts are a statistical process control tool developed in the early 1920s by Walter Shewhart. Organizations practicing statistical process control will use these charts to help determine if a process, whether manufacturing or business, is in what is considered a “state of control.”
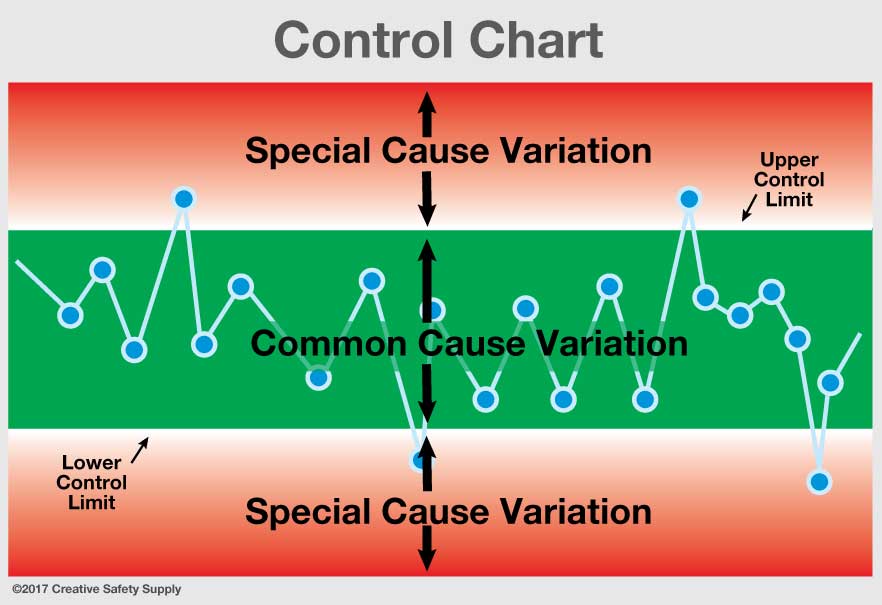
 The main purpose of control charts is to record data over time, so discrepancies or major changes in processes can be caught and fixed in a timely manner. It’s a common strategy in Six Sigma as a way to control variation because higher variations in processes results in increased quality costs. A control chart distinguishes two types of process variation:
- Common cause variation: Every process has some number of variations that are considered ‘natural’ or common’ to the process. These will typically always be present and in the realm of statistical process control, processes are operating “in control.”
- Special cause variation: Processes that display larger amounts of variation usually stem from external sources, making them “not in control.”
In the chart, a mean or range that represents common cause variation is plotted. In the image, this is the green section. Processes operating within that range are considered normal, and anything plotted outside that range is an indicator of special cause variation. Depending on how an organization wants to utilize control charts, they can also include detection signals to send an alert when a process changes. This allows whoever is collecting data to decide whether they want to continue monitoring the process or begin a process improvement project. If no triggers are identified within the control however, the chart is stable and. Control charts are not a one-time activity, but rather they are used to track processes over time and help monitor variation activity. This can help continuous improvement efforts and allow organizations to ensure quality, setting the groundwork for future growth.
Similar Glossary Terms
- Statistical Process Control (SPC)
- Gantt Charts
- Pareto Charts
- Taguchi Method
- Quality Control Circle
- Quality Engineering
- Spider Chart
- Levey Jennings Chart
- Capability


