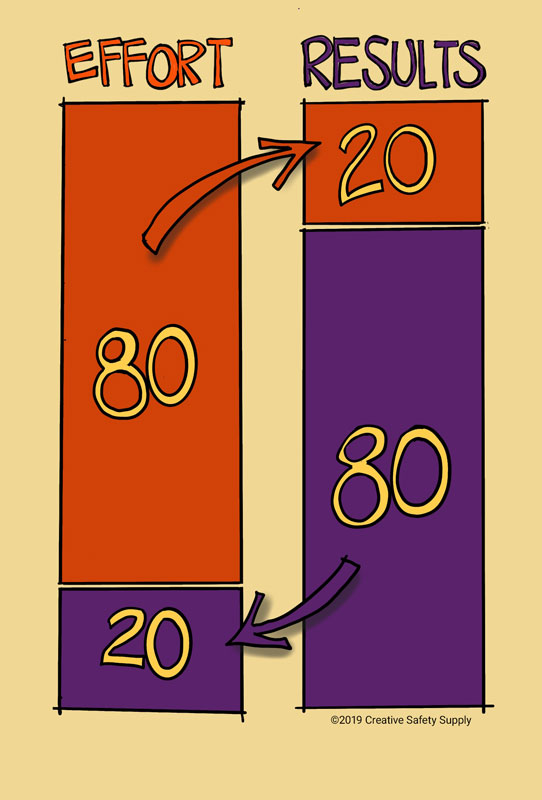
One of the first tasks that engineers are required to do is to learn to prioritize ideas and tasks. They're made aware very early on in their careers to differentiate between the "significant" & the "trivial many," meaning that they should concentrate on the few things that really make a difference and not squander time and money on things that have little importance or significance.
There has even been a numerical term developed for it. It's called Pareto's 80-20 principle and means that 80% of problems arise as a result of only 20% of the entire range of problems evidenced. Another variation of this tenet infers that 80% of problems evidenced are as a result of 20% of all causes witnessed.

Consequently, if someone is looking to tackle a problem, the 20% of the causes that result in 80% of problems (the "vital few") must first be identified and then eliminated before the remainder can be addressed. Pareto Charts are a straightforward tool to enable engineers to prioritize the causes of problems.
Types of Pareto Diagrams
A pareto chart is a sliding bar chart that illustrates the frequency of occurrences or the comparative sizes of either. Users can see the categories of the problems observed to ascertain which of the existing problems arise more often than others. They can also observe the causes of a specific problem to find out which of the causes of a specific problem happen more often. The range of categories is illustrated on the bar chart's x-axis.
Apart from its main bar chart, pareto charts often include a line graph that illustrates the cumulative proportion of occurrences at each bar of the bar chart. This line graph, also known as the "cumulative percentage line," is regularly used to determine which bars belong to the "vital few" and which are relegated to the "trivial many."
Bars that belong to the previous grouping are those that make up the majority of problems or causes observed. The last point on the chart corresponds to the last bar of the bar chart (typically the "others" bar), and may relate to 100% of cumulative occurrences.
Pareto charts offer a number of advantages:
- It helps a team concentrate on problems or causes that have the most significance or impact.
- It illustrates the comparative importance of problems or their causes in a straightforward, quick-to-understand, visual layout.
- It may be used frequently in cycles to create ongoing improvements methodically (for each subsequent cycle).
To create Pareto charts, the following tips are suggested:
- Select a problem that requires attention
- Find the problem's underlying causes based on accessible information and via group brainstorming sessions.
- Make a decision about these causes will be monitored for the data gathering for the Pareto charts. For example: Regularity of incidence, expense, etc.
- Classify the period and time frame for the data gathering. It must be long enough to give meaningful information about the actual state.
- Carry out the information according to pre-determined, defined time-frames. Observe the incident's regularity or cost for all causes witnessed and ensure that any that haven't been considered before for tracking are counted in a separate miscellaneous category.
- Tabularize the causes in their order of diminishing frequency, and allocate a column each for:
- The frequency of occurrence (or effect on cost)
- The proportion of the cause
- The cumulative percentage correlating to each cause
- Create Pareto charts using the tabulated information and applying the Pareto chart format described above.
- Read the Pareto chart and choose the "vital few" that should be looked at right away.
Similar Glossary Terms
- Control Charts
- Gantt Charts
- Yamazumi Chart
- Levey Jennings Chart
- Spider Chart
- Burndown Chart
- Statistical Process Control (SPC)
- PERT Chart
- Pick Chart


