VIF, the Variance Inflation Factor, is used during regression analysis to assess whether certain factors are correlated to each other and the severity of this correlation. It measures how much an dependent factor (such as the sales for a specific product) varies due to the influence of other factors (such as the season/weather). Essentially, the VIF tells you the effect of correlations among your predictors for the returns and costs of a product.
If your VIF number is greater than 10, the included factors are highly correlated to each other and have a great amount of influence. If the VIF is close to 1 (with 1 typically being the ideal target), then the dependent factor is not heavily impacted by its correlation with other factors. The higher the variance, the worse off you may be when it comes to prediction. Since the ability to make precise estimates is important to many companies, generally people aim for a VIF within the range of 1-5. A cutoff number of 5 is commonly used.
Regression Explained

Variance Inflation Factors are calculated by taking a single predictor and regressing it against other predictors. Regression is a statistical measurement that determines the strength of the relationship between one dependent variable (often indicated by a Y), and a sequence of other independent variables.
Regression is used in a variety of disciplines, but is most common in finance and investment. This measurement helps financial managers value assets, predict sales, and understand the relationships between variables. For example, regression can be used to predict a company’s sales based on GDP growth, previous sales, weather, and other conditions.
This prediction is achieved by conducting a regression analysis. A regression analysis takes a collection of random variables that are thought to predict the dependent variable (Y) and attempts to find a mathematical relationship between them. This analysis produces the Variance Inflation Factor and assesses whether factors are indeed correlated to each other. It also determines just how much influence these factors have. If more than one factor is related, this is known as multicollinearity.
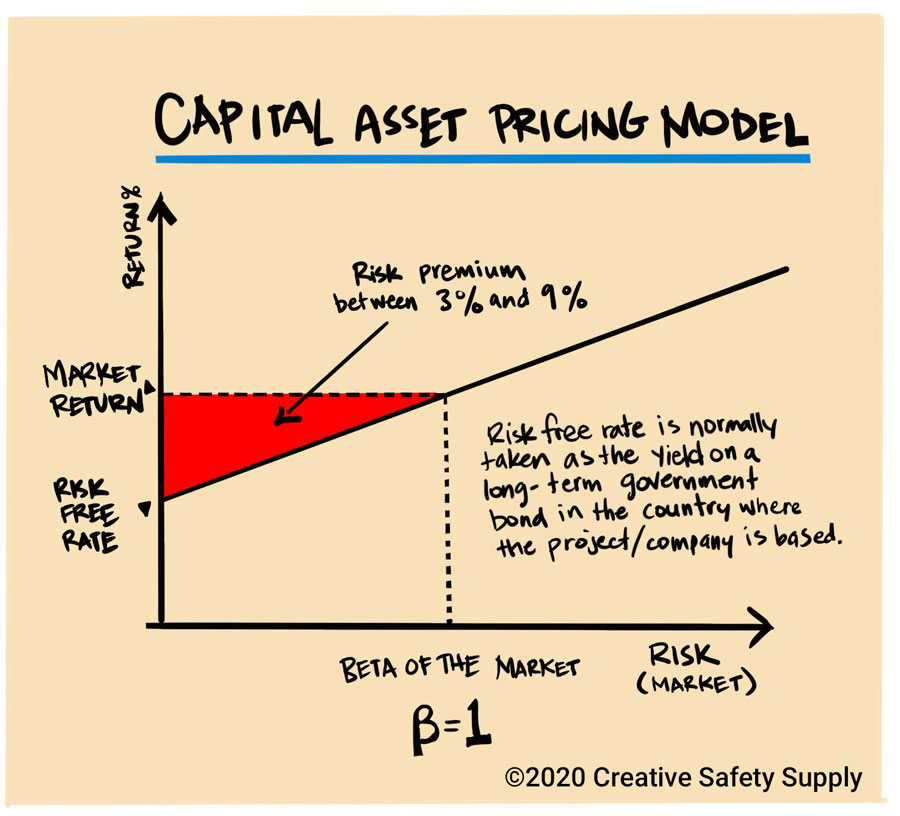
There’s a wide variety of regression analysis models available, however only a select few are commonly used. The capital asset pricing model (CAPM) is a popular tool to predict price assets and determine the costs of capital. While regression models help finance and investment professionals, they can be adopted by professionals in many different industries. They can be used as part of strategic planning and used to determine how specific factors, such as interest rates, influence the price movement of an asset. Together, regression and VIF help businesses project their expected returns and costs.
Similar Glossary Terms
- Coefficient of Determination
- Pearson Correlation
- Fixed Asset
- Gage R&R
- Asset Life Cycle
- Logistic Growth
- DFMEA (Process Failure Modes and Effects Analysis)
- Capability
- Centerlining

